 or
or 
Try this
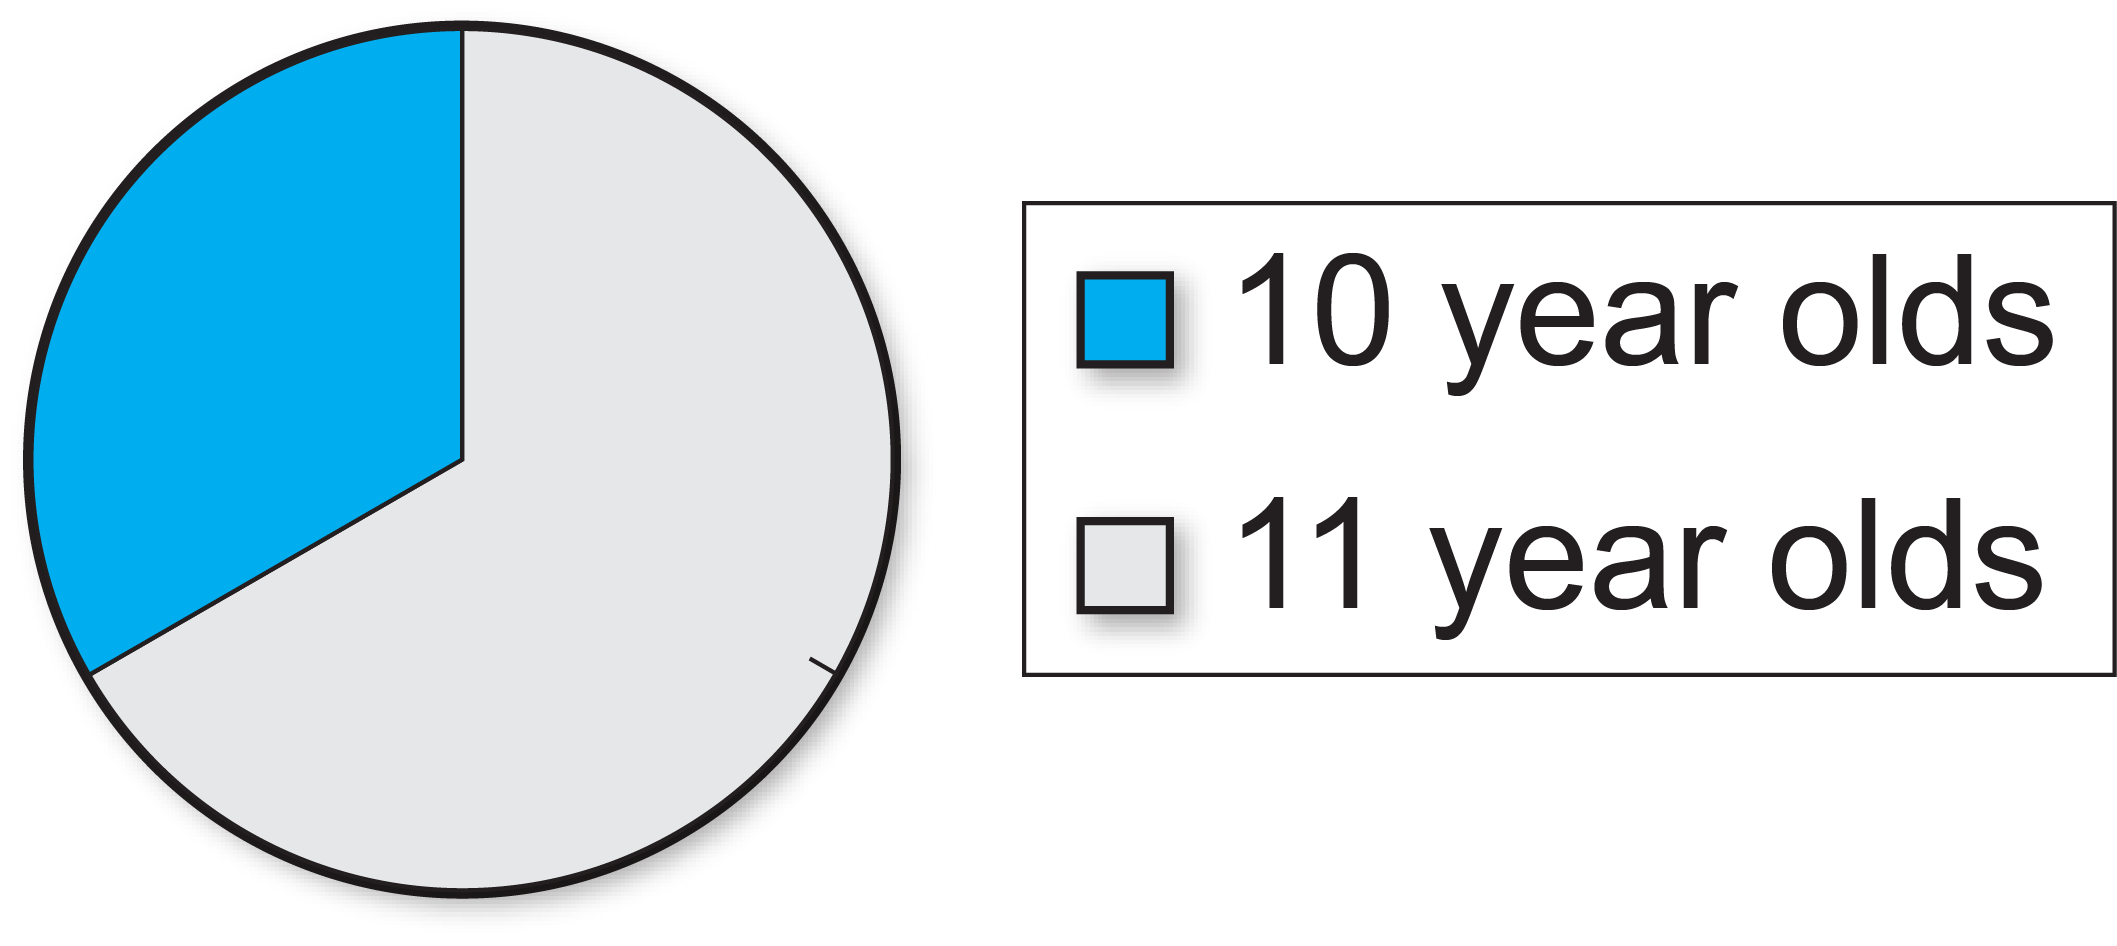
The pie chart compares the number of ten year olds and 11 year olds in a Year 6 class in April. A quarter of the 11 year olds were born in October. What fraction of the whole class was born in October?Show answer


The pie chart compares the number of ten year olds and 11 year olds in a Year 6 class in April.
A quarter of the 11 year olds were born in October.
What fraction of the whole class was born in October?
or